
Overview
Linked Jazz is a Digital Humanities project that maps the connections between artists in the Jazz community.
Connections between musicians are identified in transcripts of oral histories, and Linked Jazz presents multiple tools that show both the transcripts and connections. It’s clear that one of the goals of Linked Jazz was to provide a foundation for future Digital Humanities projects, sharing a method that can be used to transform oral histories into visual networks; on the homepage the two goals are explicitly listed, and there are other signs that the focus is more the method and tools used rather than the final product. The web and other interactive tools are hidden in a drop down menu, while it is easier to find information about the methods and creation of the project.
It appears to me that the main intended audience is other Digital Humanists looking to make similar projects, and perhaps scholars involved in researching the history and culture of Jazz.
Sources
Linked Jazz uses oral histories from the archives of Hamilton College, Rutgers Institute for Jazz Studies, the Smithsonian, UCLA, and the University of Michigan. The list of names that they used were from DBpedia, a major source of Linked Open Data. They started with the 9300 people who were identified in DBpedia as Jazz related individuals, then filtered out the people who were not mentioned in the oral histories to get the final list of artists they presented.
Processes
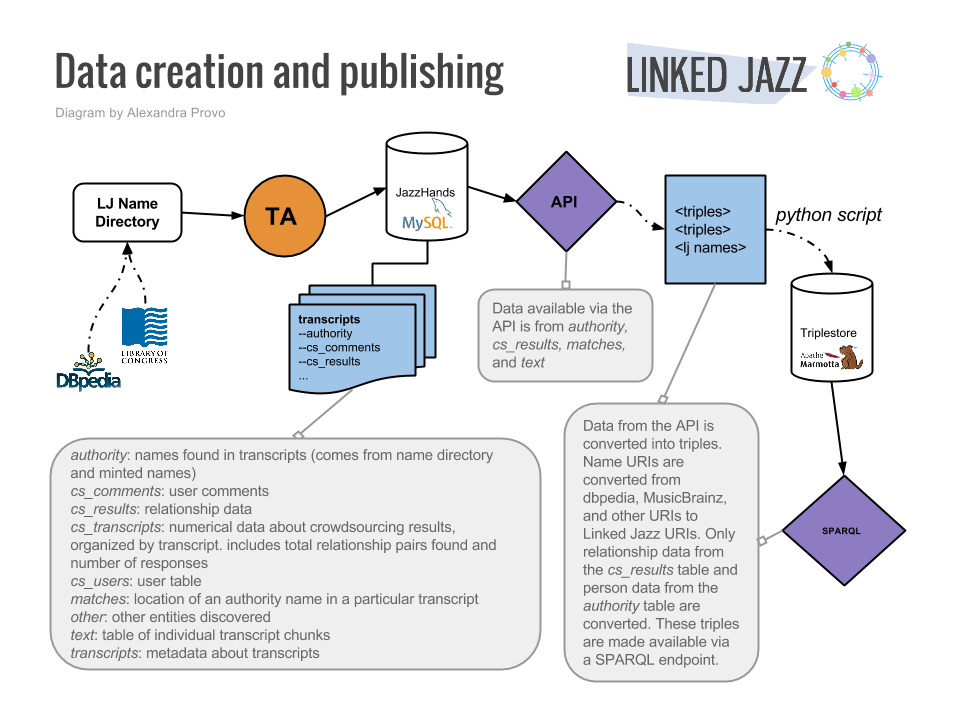
These oral histories were transcribed into text using their own analysis tool they developed to process language into transcripts, which is the main tool they are displaying to other Digital Humanities specialists interested in Linked Open Data projects. All mentions of other musicians in the oral histories was cataloged in their database, and with assistance from their crowdsourcing tool, 52nd Street, these mentions were categorized based on the type of relationship they had (based on the language used). For a more in-depth overview of their method, the following diagram is published on their website to show their process to specialists in the field:
Presentation
The data is presented in their Network Visualization Tool, which is a large interactive web of all the connections between the musicians, accessible by browser. When you hover over one musician, their connections to other musicians appear, and a short biography of them appears, as seen below.

In terms of presentation, I have a few unanswered questions: there isn’t a key, so I am wondering what the different colors of lines mean for the relationships between people. There are some people where all, or almost all of their connections are in one color, and I’m not sure why. I also wonder if there is a way to quantify the strength of the relationships between musicians given the number of mentions of each other in the transcripts; perhaps this could be shown in the Network Visualization Tool by different line weights? I also wonder whether crowdsourcing was an original part of the project, or whether it was included later to refine the data.