Disclaimer: This is for someone who is familiar with coding but does not necessarily need a background in R as the basics can be inferred.
The dplyr package is a powerful tool for editing data which is essential for Digital Arts & Humanities work. I think it is a better alternative to OpenRefine as it lets you do much more in my opinion. It provides a comprehensive set of functions that allows users to quickly and accurately manipulate data. Dplyr is efficient and easy to use, making it an ideal tool for data analysis. Dplyr is also an excellent choice for digital humanities, as it provides a straightforward way to clean and organize data. It enables users to quickly filter, group, and summarize data and allows users to easily combine multiple data frames into one. With dplyr, users can also rename and recode variables, and manipulate strings, dates, and times. In addition, It allows users to create customized plots and graphics that can help to quickly identify patterns and trends in the data. These visualizations can be especially useful for digital humanities, as they can help researchers to quickly interpret and understand the data. In addition to its data manipulation and visualization capabilities, dplyr also offers a wide range of statistical functions. These functions enable users to quickly calculate summary statistics and perform regression analyses. This makes dplyr an ideal tool for digital humanities, as it provides researchers with a wide range of statistical tools that can be used to analyze data and draw conclusions. Overall, the dplyr package is an invaluable tool for digital humanities. It provides users with a powerful set of data manipulation and visualization tools, as well as a wide range of statistical functions.
- First step – Install R studio or access this link if you are a Carleton Student. As a Carleton student you can use your Carleton Credentials to sign in to R.
2. Open R Markdown- It should look like this and appear as a .Rmd

3. Import your dataset! For this example we will assume you chose to import it as a csv. First just place the csv on your desktop and implement the simple code in the second chunk. You can do a similar process for other types of data but I am not going to go over it in this tutorial.
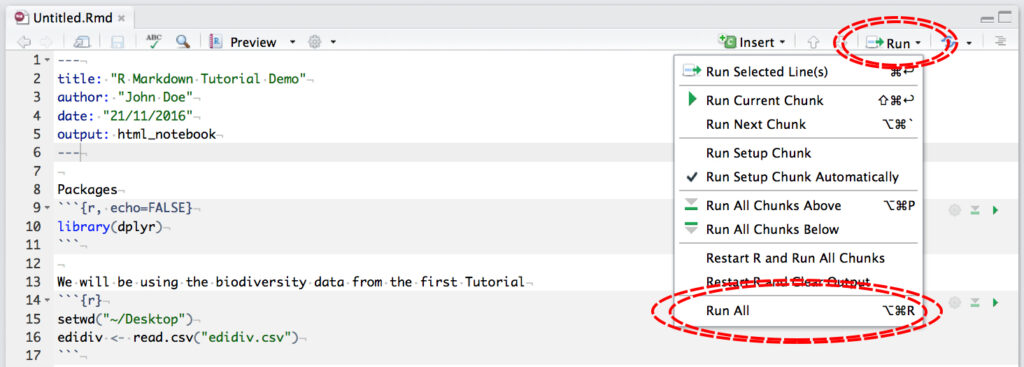
4. Install the dplyr package- simply enter install.packages(“dplyr“) in a chunk which is the grey space between ”'{r} and ”’ . After this perform library(“dplyr”) as performed above. One needs to install any package the first time it is used and then use library if they want to use it after the first install.
5. Clean and mutate your data to your liking! Now you are ready to edit your dataset. This helpful cheatsheet will make the process a whole lot easier. Here is a link if the image is too blurry (this is also a manual on dplyr). If you want to see someone do this to their own data set here are videos, 1 & 2. In this video these two videos the basics are covered.
