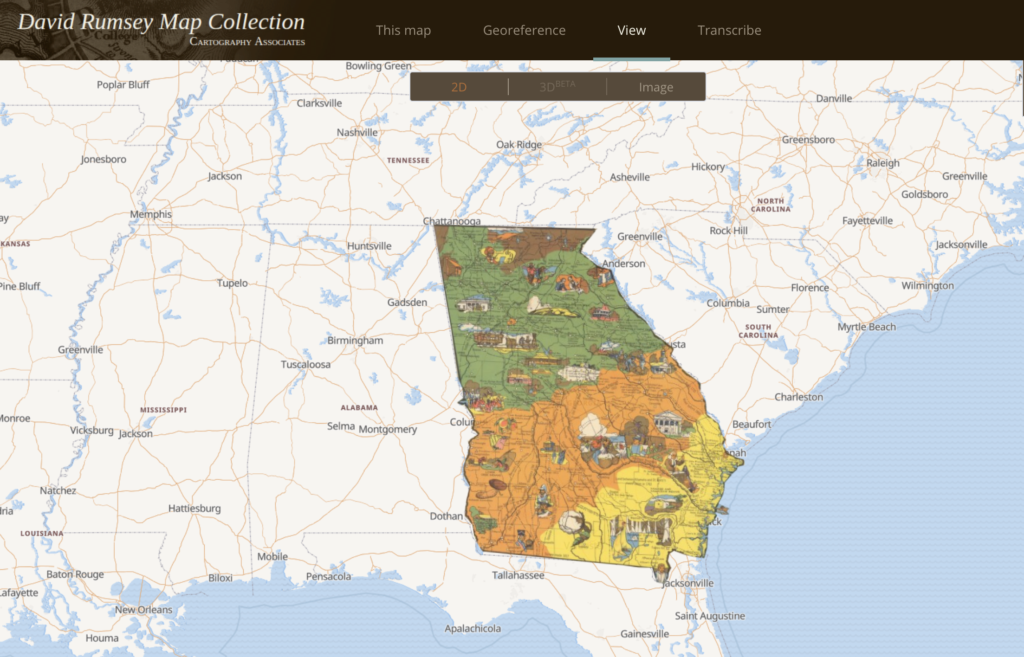
This week, our DGAH section took a dive into GIS and georeferencing technology by investigating a slew of different applications of data visualization and spatially-expressed projects. To put the technology to the test, we were assigned to georeference a historical map and match it to its modern day counterpart. I was fortunate to be given the pictured state map of Georgia, which is an illustrated map published in 1940.
My freshman year I participated in ENTS 120, which is the intro to GIS course, so I came into today’s project with prior experience, not that it necessarily helped. GIS projects are very complex, large and nuanced works that oftentimes require full teams of individuals to produce a final project. Going back into the process—even to do something so simple as creating a map overlay, laying down at least thirty map-cuts, and creating a roughly matching state border—reminds me how grateful I am that somebody else specializes in this technology so that I don’t have to. It’s an incredibly useful tool; but has a steep learning curve and gets complicated very quickly.
The David Rumsey Map collection allows for a number of different download/export options for the created map overlay; from .json object to TIFF layer (useful in Geodetic Imagery System software packages) which allows for a high degree of backwards-compatibility. An application for this compatibility could be exporting the file to GIS in order to determine which cities/towns have stood the test of time.
On the other hand, there are a few gripes I have with this implementation; specifically accuracy. Map accuracy is incredibly important in depicting spacial data, and the above map I’ve produced is anything but that. To create an actually accurate map overlay, you’d need a whole suite of georeferencing tools (or the time on your hands to meticulously trace the state border) to accurately pinpoint control points for a state boundary.
Georeferencing is, definitively, a space-oriented technology used to answer space-oriented questions. While it is incredibly useful in what it was built for, its primary concerns are the ‘where/what’ and not the ‘how/who’ with respect to what questions it answers. That said, there are many auxiliary tools that can be used to transform this technique into a fleshed out story; such as ARCGIS story maps, which can add context to an otherwise solely statistical model. By itself, however, this technology is hindered by its inability to display a wider picture.
—A.J.